Background
Introduction
Food and nutrition policies and programs form an integral part of the country's development plans. In this respect, in the Country Programme of implementation of the Millennium Development Goals, the Food and Nutrition Council was tasked to establish a Food and Nutrition Surveillance system, which will provide indicators to monitor the achievement of these Goals, in particular the 1st goal of eradicating hunger and poverty.
The objective of the surveillance system is to provide information needed to inform decision making in order to ensure appropriate and timely interventions for improved food security and nutrition outcomes. Many stakeholders, both public and private, are involved in the food security and nutrition outcomes and need this information to inform their activities.
Although food and nutrition data is available through the National Health Information System (NHIS), the Zimbabwe Vulnerability Assessments, and also periodic nutrition surveys, there is a gap in the mechanism or capacity to provide this data regularly and timely to inform appropriate decision making and action by stakeholders.
Thus in 2004, in order to implement its mandate, the Food and Nutrition Council initiated the establishment of an effective food and nutrition surveillance system that would produce timely information required for decision making. The first phase of this system involved the setting up of a pilot sentinel site surveillance.
Implementation of pilot sentinel site surveillance
A total of 10 districts were selected from the 10 Provinces including Harare and Bulawayo. The target group was primary school children in grades 1-3 and under-fives aged 6- 59 months. The table below shows the selected districts.
| Province/City |
Selected District |
| Bulawayo |
Bulawayo urban |
| Harare |
Harare urban |
| Mashonaland Central |
Centenary |
| Mashonaland East |
Mudzi |
| Mashonaland West |
Kariba |
| Manicaland |
Chimanimani |
| Midlands |
Kwekwe |
| Matabeleland North |
Tsholotsho |
| Matabeleland South |
Bulilimamangwe |
| Masvingo |
Gutu |
Main Findings
- Maize most expensive in Matebeleland sites.
- Overall 36% households producing their own maize for consumption.
- Wasting/thinness or current hunger was highest among school children in Bulilimamangwe (6.7%) and Tsholotsho (6.1%) and in Bulilimamangwe (5.5%) among children 6-59 months.
- Stunting was highest in Chimanimani (28%) among children 6-59 months.
- Commercial farms (averaged over 10 districts) have alarmingly high stunting (47%) and high underweight (23.5%) among children 6-59 months.
- All three nutrition indicators were worse for orphans compared to non-orphans.
- Orphans are three times more likely to be wasted /thin, two times more likely to be stunted and 1.5 times more likely to be underweight than non-orphans.
- Gutu district has the highest percentage of Orphans among children 6-59 months (18%).
- 28% households use unsafe water sources and have no access to toilets.
- Centenary (94%) and Kariba (90%) districts reported the highest number of children who did not receive Vitamin A supplementation within the past 6 months.
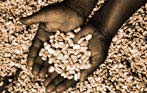
- Food Availability and Access
Food security is defined as access by all people at all times to the food needed for an active and healthy life. In the surveillance exercise, households were asked on their means of acquiring the main source of cereal, which was largely maize. The average cost of cereal per 20kg was also ascertained. The graph shows the means of acquiring main cereal by household. The average cost of cereal grains was most expensive in Bulilimamangwe $41 428.00 per 20kg, Chimanimani $35 160.00 and Tsholotsho $28 828.00. The Urban sites are largely purchasing cereal.
Nutrition Indicators (Anthropometry)
Three nutritional indicators were collected. The first is wasting (weight/height<-2s.d.'s), or acute malnutrition, which is typically brought on by a short-term food crisis. Second is stunting (height/age<-2s.d.'s), or chronic malnutrition, and may be analyzed in stable environments to measure change in chronic poverty. Third is underweight (weight/age<-2s.d.'s), which is commonly collected in growth monitoring and can reflect stunting, wasting or both. These indicators provide an indication of the nutritional status of the population. Malnutrition can contribute to morbidity and ultimately lead to mortality if not treated. In order to effectively deal with malnutrition, it is important to identify both where it is and the causes, such as food insecurity. To help identify where the particular malnutrition is located and to help target interventions, it is useful to classify by various factors such as settlement type, area and age group.
- Malnutrition by area
Wasting was highest in Bulilimamangwe among both school children and children 6-59 months. An acceptable level in a normal situation is about 2%. There is need for a deeper understanding of this data and to closely monitor Matabeleland North and South.
In children 6-59 months, stunting, or chronic malnutrition, was highest in Chimanimani at 27.5%, and lowest in Bulawayo Urban. Underweight was high in Tsholotsho and Bulilimamangwe at 19.4% and 20.7% respectively.
.gif)
- Malnutrition by settlement type (6-59 months
Wasting levels were below 5% among all settlement types. Stunting (47%) and underweight (23.5), were high among commercial farms*. Levels were also high in the resettlement areas, stunting (31%) and underweight (19.5%).
*Sample size n=34 for commercial farm
- Malnutrition by age category (6-59 months
Wasting levels are below 5% for all age categories. Stunting and underweight (32.5% and 21%, respectively) are high for 12-23 month old children. This group is traditionally vulnerable as this is the weaning period.
- Malnutrition by orphan status
All of the nutrition indicators are worse for orphans, defined as either one or both parents being deceased. Moderate stunting, a sign of long-term nutritional deficiency and a measure of poverty, is high at 35%. Likewise, severe wasting is very high at 6.5%. Overall orphans had a treble chance of being acutely malnourished, a double chance of being stunted and 1.5 times chance of being under weight compared to their counter parts with both parents. (Sample size needs to be taken into account.)
- Orphanhood (6-59 months)
Orphanhood has emerged higher in our findings as compared to the most recent national report. The worst affected site was Gutu with a rate of 18.3 %. Cross tabulation of wasting with orphanhood found that orphans in, Mudzi, Chimanimani and Kwekwe districts were more malnourished than the other districts.
- Water and Sanitation
Water and sanitation remains a cause for concern. Five of the ten districts have over 40% of households with no toilet. Likewise, five out of ten districts have over 20% of households using unsafe water sources. The distance traveled to the water source was also collected and is available in the full report.
- Vitamin A coverage
- By district
This graphic is alarming with Mudzi, Kariba, Gutu, Tsholotsho, Bulilimamangwe, and Kwekwe all having over 70% of children NOT receiving vitamin A supplements. Bulawayo has the best coverage with over 40% of children having received and verified with a Health Card.
- By age group
Again, coverage of Vitamin A supplementation is low with over 60% of both age groups not having received in the previous 6 mos. The 12-23 months had higher coverage (30%) than 24-59 months. This trend of low coverage was also seen when stratifying by orphan status - there was little difference between orphans and non-orphans.
-
-
Discussion
- Poor nutritional status was highest in sentinel sites in the southern part of the country (Bulilimamangwe, Tsholotsho, and Chimanimani) compared to other sites. Similar findings were found in the MOHCW 2003 Nutrition and EPI survey.
- Orphans are at a greater risk of being malnourished and stunted when compared to non-orphans, according to reports produced by ZimVAC and also by UNICEF. This was found to be true in our findings.
- Coverage of vitamin A supplementation lower than what was found in 2003 Nutrition and EPI survey.
- Program Recommendations/Points for Action
- Need to scale up OVC programmes.
- In-depth study on factors associated with high malnutrition rates to be done in Southern region sentinel sites.
- Need to investigate factors associated with poor vitamin A coverage in the vitamin A supplementation programmes.
-
Way Forward for Surveillance
- While useful information has been generated from the 10 surveyed Districts, the surveillance system needs to be scaled up to cover all the districts in Zimbabwe.
- The first and second round of data collection has been funded by UNICEF, but there is a need to secure Government core funding to ensure national ownership and sustainability of this programme.
- Developing a dissemination strategy to ensure the use of this information to make timely decisions about policies and programs.
- Integrate surveillance system at the grass root level (village level).
- Include HIV indicator in surveillance system.
- Monitor trends over time to obtain a better understanding of the situation.
For further information or to obtain a copy of the full report,please contact:
SIRDC
The Food and Nutrition Council
1574 Alpes Rd.
862586
|

 Related documents
 - 72Kb < 1min (6 pages)